Understanding In-Depth Investment Reports and Their Value
In the dynamic world of finance, making informed investment decisions is essential for maximizing returns and mitigating risks. One of the most valuable tools available to investors—both institutional and individual—is the In-Depth Investment Reports. These comprehensive analyses provide a granular view of assets, markets, and economic indicators, enabling investors to develop strategic, data-backed approaches to their portfolios. This article explores the significance of these reports, their core components, best practices for utilization, successful case studies, and future trends shaping investment reporting.
Components of Effective Investment Reports
Key Data Points and Metrics to Include
Effective investment reports are grounded in a robust set of data points and metrics. These include financial statements—income statements, balance sheets, and cash flow statements—that offer an overview of a company’s health. Investors should scrutinize ratios such as Price-to-Earnings (P/E), Return on Equity (ROE), Debt-to-Equity (D/E), and EBITDA margins to gauge profitability, leverage, and operational efficiency. Macroeconomic indicators like Gross Domestic Product (GDP) growth rates, inflation figures, and unemployment statistics contextualize individual asset performance within broader economic trends.
Additional metrics like dividend yields, earnings growth projections, and industry-specific benchmarks provide nuanced insights. For example, a technology firm’s innovation pipeline or regulatory environment impacts its future earnings potential, which a detailed report should highlight. The comprehensive inclusion of these data points transforms raw numbers into strategic intelligence.
Advanced Analytical Techniques and Tools
Modern investment reports leverage advanced analytical techniques to interpret complex datasets. Quantitative methods such as regression analysis, machine learning algorithms, and Monte Carlo simulations help forecast potential outcomes under varied scenarios. Technical analysis tools, including moving averages, Relative Strength Index (RSI), and candlestick patterns, assist in market timing and trend identification.
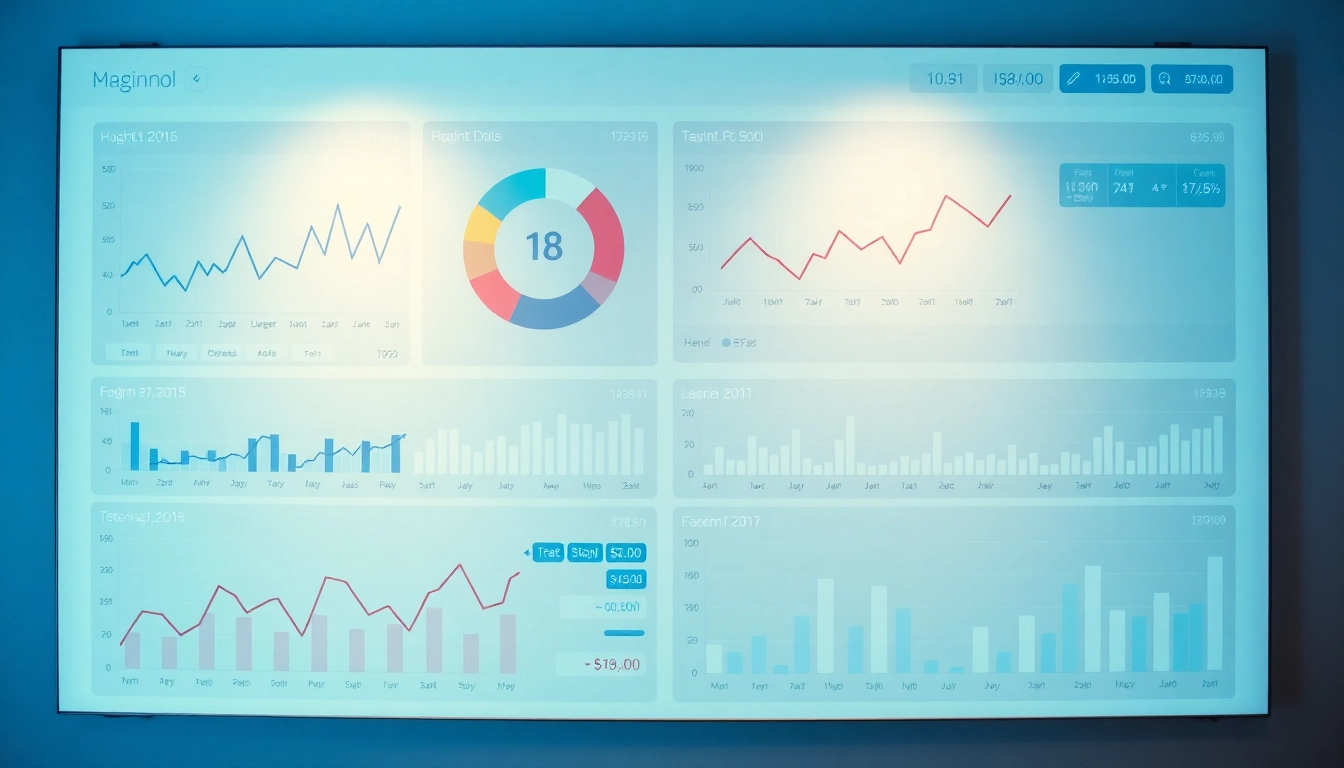
Furthermore, data visualization platforms like Tableau or Power BI facilitate the interpretation of large datasets, presenting insights through interactive dashboards. These tools help investors identify hidden relationships, anomalies, and emerging trends—critical for making proactive decisions.
Interpreting Trends and Forecasts in Reports
Identifying meaningful trends within reports involves comparing historical data with current metrics and applying statistical significance tests. For example, a consistent upward trajectory in revenue coupled with improving profit margins signals sustainable growth. Forecasting models project future asset performance based on historical patterns, macroeconomic forecasts, and industry cycles.
Investors should evaluate the assumptions underlying these forecasts, scrutinize confidence intervals, and remain aware of potential biases. Proper interpretation ensures that reports serve as guides rather than definitive predictions, enabling strategic adjustments in response to evolving market conditions.
Best Practices for Analyzing and Utilizing Investment Reports
Steps to Evaluate Report Accuracy and Relevance
Before acting on any report, investors must verify its credibility and relevance. First, assess the source: reputable financial institutions, industry experts, or established data providers lend credibility. Next, cross-validate data points with multiple sources to identify discrepancies. Analyzing the report’s methodology reveals whether assumptions are sound and models are appropriate.
Timeliness is critical; outdated data can lead to misguided decisions. Confirm that the report incorporates the latest market developments and economic indicators. Finally, evaluate the report’s scope—does it cover the specific assets or sectors relevant to your portfolio? Ensuring accuracy and relevance minimizes exposure to false signals.
Integrating Reports into Your Investment Workflow
Effective integration of investment reports involves structured inclusion within your decision-making processes. Develop a formal review routine—daily, weekly, or monthly—corresponding to your investment horizon. Utilize checklists to systematically analyze key data points, risk factors, and forecasts.
Leverage these insights to inform asset allocation, timing, and risk management strategies. For instance, if a report indicates weakening fundamentals in a sector, consider rebalancing. Combining qualitative insights from reports with your judgment enhances holistic decision-making.
Common Pitfalls and How to Avoid Them
Investors often fall prey to overreliance on single reports, confirmation bias, or misinterpretation of data. To mitigate these risks, always diversify your sources and perspectives. Beware of reports with conflicts of interest or overly optimistic/pessimistic assumptions. Maintain skepticism by questioning the underlying methodologies and assumptions.
Additionally, avoid reacting impulsively to short-term fluctuations if reports highlight underlying long-term trends. Regularly revisiting and updating your analysis framework ensures resilience against market noise and cognitive biases.
Future Trends in Investment Reporting
Emerging Technologies Enhancing Report Accuracy
Technological advancements like artificial intelligence (AI), big data analytics, and blockchain are revolutionizing investment reporting. AI algorithms can process vast datasets quickly, identify subtle patterns, and generate predictive insights with higher accuracy. Blockchain’s transparency enhances data integrity, reducing the risk of manipulation.
Real-Time Data Integration and Dynamic Reports
Traditional reports often involve delays, limiting their usefulness in fast-moving markets. Emerging tools now enable real-time data integration, providing investors with instant updates on key metrics. Dynamic reports, which automatically adjust forecasts and analysis as new data arrives, facilitate proactive decision-making and risk mitigation.
Personalized Investment Reports and Artificial Intelligence
AI-driven personalization tailors reports to individual investor profiles, preferences, and risk tolerances. This customization enhances relevance and usability, allowing investors to focus on relevant sectors, metrics, or scenarios. As AI models learn from user behavior, they dynamically improve their insights, offering increasingly precise guidance.


